RESET - Remote Sensing of Evapotranspiration (ET)
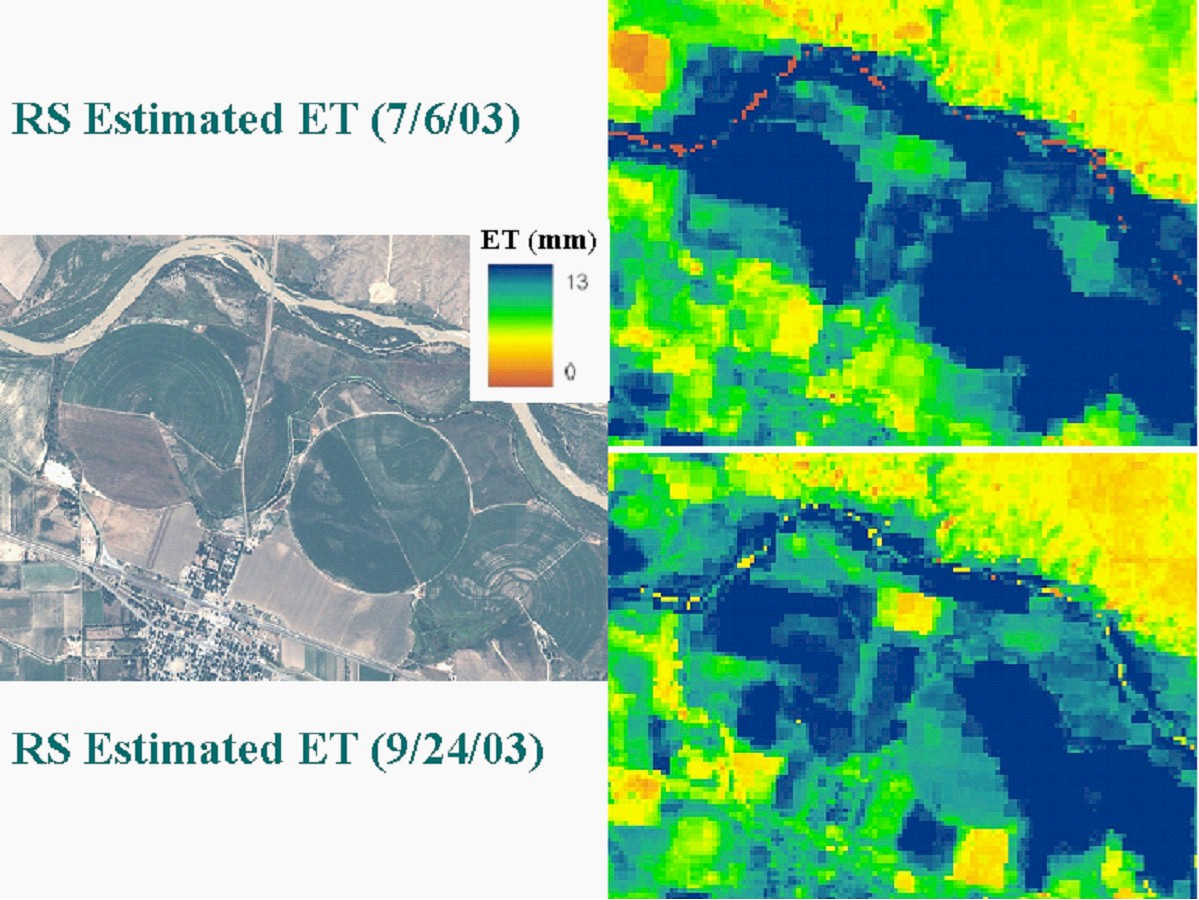
Crop ET can be estimated using satellite imagery by applying an Energy Balance approach. This approach uses the thermal information from the infrared band as well as the crop reflectance to calculate the actual of ET. When using Landsat imagery with the Energy Balance approach, this yields a 30 m grid with each cell containing the instantaneous crop ET at the time of the satellite image.
Integrated Decision Support Group (IDS) at Colorado State University has implemented a remote sensing algorithm similar to the Surface Energy Balance Algorithm for Land (SEBAL) which is a satellite image-processing methodology used for computing evapotranspiration (ET) for an entire satellite image. We have used ERDAS images and twenty one computational steps to predict a complete radiation and energy balance for the earth’s surface along with fluxes of sensible heat and ET. We are using digital image data collected by Landsat remote-sensing satellites measuring visible, near-infrared, and thermal infrared radiation. We have used both Landsat 5 and Landsat 7 images with resolutions of 30 m and 15 m respectively. We have been working with satellite scenes from 2001 and 2003. The name of the model is Remote Sensing of ET (RESET), and it can estimate the actual ET at the time when the satellite image was taken. We have developed daily ET estimates for a total of fifteen days during 2001 and 2003. We are now developing an ET estimate for the entire irrigated area of the lower Arkansas River Valley Basin for the growing seasons of 2001 and 2003. We are doing this by relating the daily ET computed at weather stations to the ET developed from the satellite image to calculate a seasonal ET by following a procedure similar to METRIC. The RESET model uses a new methodology to address the spatial and temporal variability.
First, with RESET, multiple weather stations can be used to obtain ground data needed for interpolating between scenes. Previously developed models use just one weather station for ground data (wind speed, ET, rain). In areas with significant weather differences it is important to capture the spatial variation. By developing a surface interpolated from all weather stations that fall within a target area, the IDS Group is able to adjust the ground data input to the model for each cell (30m by 30m) based on the spatial variability of the weather stations.
The second major enhancement to the model is in the calculation of the cumulative ET between available images dates. Since we only calculate the actual ET for one day per month (assuming that we obtain one scene per month), there is a need to estimate the ET for every day in the period between the scenes. RESET uses a grid of ET values from all the weather stations in the targeted area, not just a point from one weather station.
In RESET the temporal interpolation is done by calculating the ET difference at the beginning (ETr 1) and the end of the interpolation period (ETr 2). RESET then calculates ET from all weather stations in the targeted area for all days (ET d). ET d is introduced in a grid that shows ET for each day. The difference between ETr 1 and ETr 2 develops a variable correction ratio grid (for each cell), LAMDA, that changes for each day depending on the day and location compared to the beginning and end of the interpolation period. LAMDA is applied to the ET of each day (ET d) to produce (ET dm) that is the ET estimated by the model for each day. The total ET for the period is the total of (ET dm) for all days.

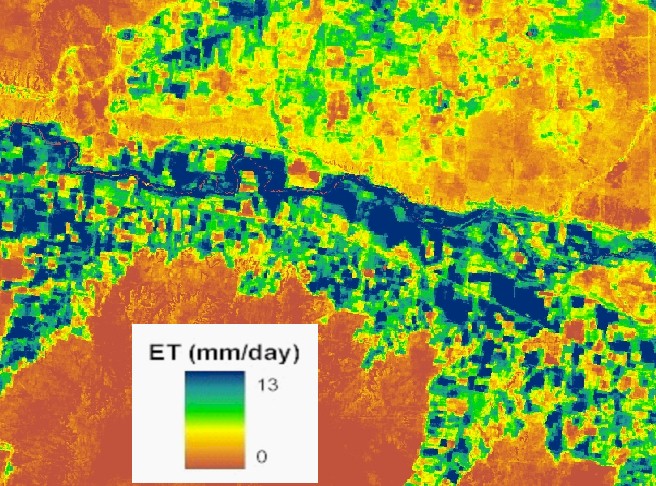
ET for a portion of the study area (Arkansas River Basin) in mm/day.
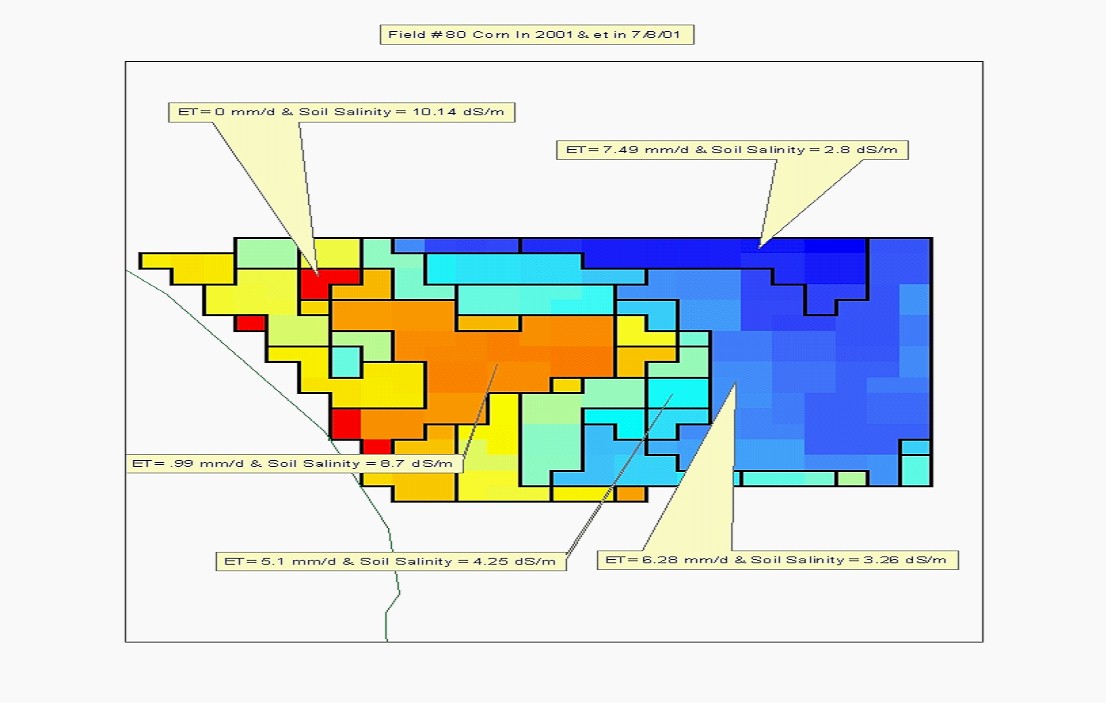
We assumed that the plant's uptake of water would be affected by soil water salinity which is directly related to soil salinity. Geo-referenced soil salinity points were taken in five fields, and a preliminary linear correlation was made between the soil salinity measurements and the ET value at each point as shown in the maps below.


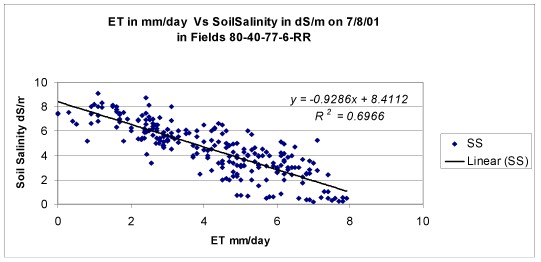
The results are very promising: the root mean square error (R) was over 0.83. This approach could be used to detect and evaluate soil salinity with acceptable accuracy for large areas at less cost than the first approach. We are continuing our research to determine ET using remote sensing. Hence we expect to improve our ability to detect soil salinity using an ET based methodology.

Corn ET in mm/day versus soil salinity (dS/m) for several fields on 7/8/01
Downloads
| File | Version | Date | Description |
|---|---|---|---|
| Reset_Seasonal_Tool_1_0.zip | 1.0 | 2007-04-11 | Latest version of the seasonal tool. Look here for help with installation.The ET Seasonal Calculator is an ArcGIS 9 tool that interpolates daily evapotranspiration (ET) rasters from Landsat images that have been processed by a surface balance energy model such as ReSET. It can also calculate single day ET and wind. The output of the tool is in grid format. |
| cimis_azmet.zip | 2007-04-12 | Access weather data database from CIMIS and AzMET weather stations. |


